How to Grade Predictions
As usual with my statistics posts, I’m sure I’m describing something that’s well-known and well-studied. However, this time I actually discovered which words experts use to talk about the same thing: in this case, self-information and scoring rule.
I did a bunch of coding for this, in Mathematica. Here’s the file.
If somebody makes a bunch of predictions, like “I’m 80% confident Syria’s civil war won’t end in 2015,” how do you tell if that person is good at predicting things? (Of course, first you have to know the results. But then what?)
For now, let’s just talk in terms of weathermen. Every day, each weatherman says, “I’m X% confident it will rain today.” How do you tell which weatherman is the best predictor?
“Surprise” as a grading metric
It’d be great if we could take a list of prediction-probabilities (a weatherman’s declared probability of rain on each day), and a list of outcomes (whether it actually rained each day), and come up with a score saying how good the predictions were. Let’s call this score the “surprise.” Like golf, a small number is better: good predictions will result in a small surprise, and bad predictions in a large surprise.
What are some features that “surprise” must have in order to make sense at all?
- The best possible set of predictions (“100%” for days it rains, and “0%” for days it doesn’t) should have the smallest possible surprise.
- The worst possible set of predictions (“0%” for days it rains, “100%” for days it doesn’t) should have the largest possible surprise.
- All other sets of predictions should have surprises strictly between those two surprises.
- Surprise should be “symmetric,” in some sense: saying “70%” and seeing rain should be just as surprising as saying “30%” and seeing not-rain.
What are some features we want “surprise” to have?
- The surprise associated with multiple predictions should be the sum of the surprises of the individual predictions. I can’t put my finger on why this seems like a nice feature, but… it does.
How about this definition, for the surprise of a single prediction?
\[surprise(p, rained) := -\ln \left(\left\{ \begin{array}{lr}p &: rained=true \\ 1-p &: rained=false\end{array} \right.\right)\]Graphing this, we get a picture like
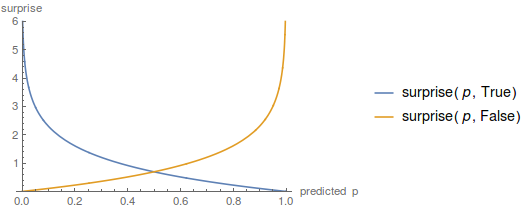
That fulfills all our criteria: zero when you’re 100% confident and correct, $\infty$ when you’re 100% confident and wrong, and something-in-between at other times.
An interesting note: if I predict something with probability $p$, how surprised can I expect to be, i.e. what’s the expected value of the surprise? Well, $p$ of the time the surprise will be $-\ln p$, and $1-p$ of the time, the surprise will be $-\ln (1-p)$. So… well, a graph:
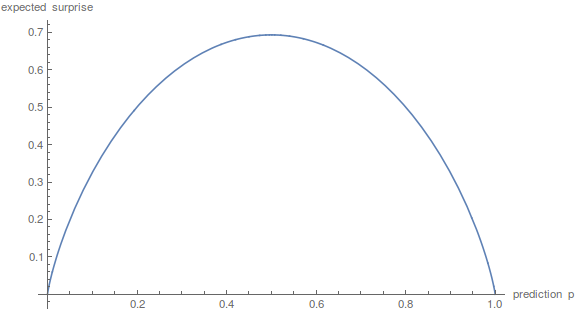
LOOK FAMILIAR? Yes, it’s exactly the entropy of a biased coin flip. I think this is a sign from God that our definition of “surprise” is good.
P-values
A natural question is: “Is it possible that rain truly is literally unpredictable, and this weatherman is doing literally the best that any non-magical weatherman can?”
i.e. “Can we reject the hypothesis that this weatherman is as good as possible?”
i.e. “If this weatherman is as good as possible, if he made these predictions, what fraction of the time would we expect the surprise to be this high?”
I’m not sure if there’s a clever way to answer this question – but what we can do is, for any given predictions, generate a zillion outcome-sets assuming that the weatherman is ideal, and see how often those outcome-sets’ surprises are larger than the observed ones.
For the heck of it, I applied this technique to Scott Alexander’s 34 2015 predictions, and got a p-value of .86, meaning that we continue to not have any evidence Scott isn’t ideal.